A $200,000 home once represented a substantial purchase in many American housing markets. Today, buyers in numerous cities would be pleased to find a reasonably maintained property at that price.
Of course, older homeowners remember something younger buyers often overlook. Houses might have been cheaper decades ago, but mortgage rates sometimes reached double digits, making those seemingly affordable properties surprisingly expensive to finance.
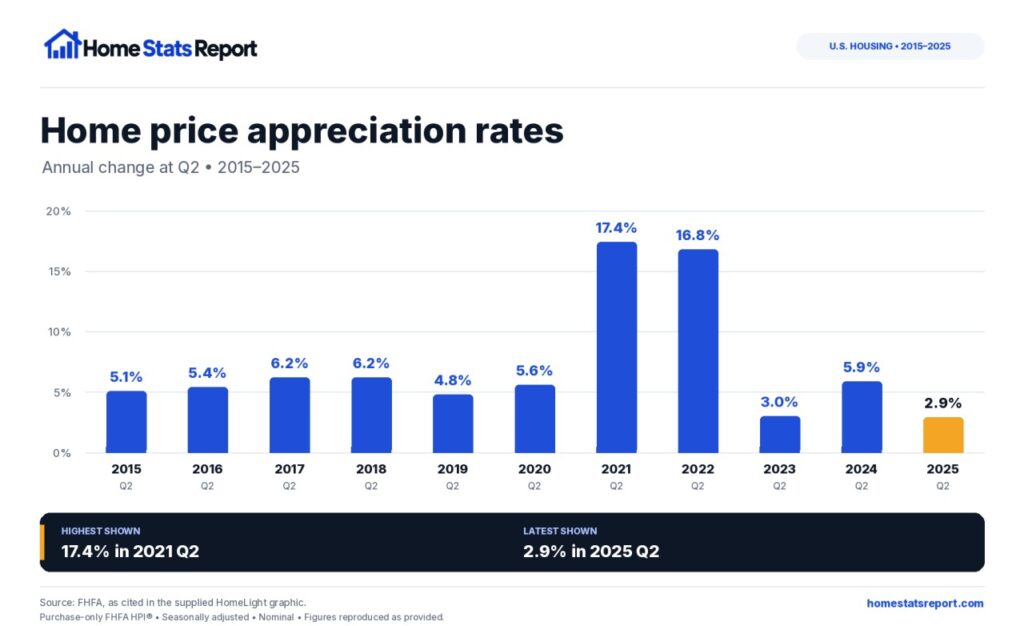
Historically, the average home appreciation per year has been approximately 3% to 5% in the United States.
However, that range conceals periods of rapid growth, substantial price declines, and years when property values barely moved.
Figures we saw recently suggest a slower market. National home prices increased 2.4% between August 2025 and August 2026, falling short of the historical benchmark.
So, how much should homeowners and buyers rely on historical appreciation rates when making financial decisions today?
What Is the Average Home Appreciation Rate per Year?
Home appreciation measures the increase in a property’s market value over a particular period.
For example, a house purchased for $250,000 that subsequently increases in value to $275,000 has appreciated 10%.
Across the United States, the average home appreciation per year has generally fallen within a historical range of 3% to 5%, before accounting for inflation.
Historical housing data covering 1967 through 2024 suggests an annual appreciation rate of approximately 4.27%. However, that figure represents a long-term estimate rather than a return homeowners can expect every year.
Another important consideration is compounding.
A property appreciating 4% annually gains value based on its increasingly higher market price. Over several decades, that process can produce substantial growth.
Consider a $300,000 house appreciating at a consistent 4% annually.
| Ownership period | Estimated home value |
| Purchase | $300,000 |
| After 1 year | $312,000 |
| After 5 years | $364,996 |
| After 10 years | $444,073 |
| After 20 years | $657,337 |
These figures assume uninterrupted annual appreciation, which real housing markets rarely deliver.
Appreciation also differs significantly from home equity.
Appreciation measures changes in property value, while equity represents the difference between a home’s market value and its outstanding mortgage balance.
Homeowners can build equity by reducing their mortgage debt even when housing prices stagnate. Likewise, declining property values can reduce equity despite regular mortgage payments.
How Has Home Appreciation Changed Over the Years?

Historical appreciation rates become more informative when examined alongside the economic conditions that shaped them.
Several periods demonstrate why housing prices rarely follow a predictable pattern.
1970s and 1980s – Inflation and Expensive Mortgages
Inflation contributed to significant increases in nominal home prices during the 1970s and early 1980s.
However, borrowing costs were exceptionally high.
According to historical mortgage data maintained by the Federal Reserve Bank of St. Louis, the average 30-year fixed mortgage rate reached 18.63% during the week ending October 9, 1981.
A $100,000 mortgage at that interest rate would have required approximately $1,556 in monthly principal and interest.
Lower purchase prices did not necessarily translate into affordable housing.
2000s – Rapid Appreciation Followed by a Housing Crash
Easy credit, speculative buying, and increasingly risky mortgage lending contributed to substantial home price growth during the early 2000s.
Once the housing bubble collapsed, property values declined sharply across numerous markets.
Many homeowners found themselves owing more on their mortgages than their houses could sell for.
That period demonstrated why average home appreciation per year should never be interpreted as a guaranteed investment return.
2020-2022 – Unusually Strong Price Growth
Historically low mortgage rates, limited housing inventory, and changing residential preferences contributed to intense buyer competition during the pandemic.
In many communities, properties received multiple offers shortly after listing.
Annual appreciation substantially exceeded long-term historical averages in numerous markets.
2023-2026 – Slower Appreciation
Higher mortgage rates reduced purchasing power and made homeownership more difficult for many households.
Although national property values continued increasing, appreciation slowed considerably compared with the pandemic-era boom.
Some regional markets even experienced price declines.
A historical average can establish context, but it cannot reliably predict what an individual property will be worth next year.
How Much Have Home Prices Appreciated in the Last 12 Months?
According to the Federal Housing Finance Agency’s October 27, 2026, House Price Index report, U.S. home prices increased 2.4% between August 2025 and August 2026.
Three figures show us the latest available national data.
| FHFA housing indicator | Reported change |
| Annual appreciation, August 2025-August 2026 | 2.4% |
| Monthly appreciation, August 2026 | 0.3% |
| Annual appreciation, July 2026 | 2.6% |
August’s monthly change is seasonally adjusted. Figures reflect data available as of November 4, 2026. Compared with the historical average home appreciation per year of 3% to 5%, the latest annual increase indicates weaker national price growth.
Different housing indexes can also produce noticeably different results.
For example, U.S. home price growth reached 3.7% in August 2026, compared with the 2.4% annual increase reported by FHFA. Different methodologies and transaction coverage help explain why those figures do not match.
However, slower appreciation should not be confused with falling prices.
Nationally, home values continued increasing, only at a more moderate pace.
Regional differences were also considerable.
FHFA reported annual appreciation ranging from 0.5% in the Mountain division to 4.4% in the East North Central division for August 2026.
Such differences matter because housing decisions occur in individual communities, not across an entire national index.
A homeowner in a growing Midwestern community may experience stronger appreciation than someone living in a Western market facing weaker demand.
Why FHFA Data Can Differ From Median Sale Prices

FHFA’s House Price Index tracks changes using a repeat-sales methodology, comparing transactions involving the same properties over time.
Its principal purchase-only index relies on qualifying mortgage transactions associated with Fannie Mae and Freddie Mac.
Median sale prices measure something different.
If a larger proportion of expensive properties sell during a particular month, the national median can increase even when comparable individual homes have experienced little appreciation.
Conversely, a greater share of lower-priced transactions can pull the median downward.
Consequently, repeat-sales indexes generally provide a more consistent measure of property value changes, although their financing coverage means they do not capture every transaction.
What Determines How Much a Home Appreciates?
Two properties purchased for $350,000 can have considerably different values ten years later. Even houses located only a few miles apart may experience different appreciation rates.
Four factors have the greatest influence on property values.
Supply and Demand
Limited housing inventory combined with strong buyer demand generally supports higher prices.
When available listings increase and qualified buyers become scarce, sellers face greater pressure to negotiate.
Local inventory levels are particularly important when evaluating the average home appreciation per year in a particular community.
A city experiencing population growth and limited construction may see stronger price increases than one with an expanding supply of unsold properties.
Mortgage Rates
View this post on Instagram
Higher borrowing costs reduce purchasing power, limiting what prospective buyers can afford.
Consider a $300,000 mortgage with a 30-year repayment period.
At 4% interest, monthly principal and interest total approximately $1,432. At 7%, that payment increases to approximately $1,996.
That’s an additional $564 per month for the same borrowed amount, excluding property taxes and insurance.
Higher interest rates do not automatically cause property values to decline. However, they can reduce buyer competition, particularly in markets where affordability is already stretched.
Location and Local Employment
Employment opportunities, population changes, schools, transportation, and neighborhood conditions all influence housing demand.
Communities attracting new employers and residents may experience stronger appreciation than areas struggling with population losses.
Even within the same city, property values can behave differently depending on neighborhood demand.
Property Condition
Regular maintenance and sensible renovations can help protect resale value.
However, spending $60,000 remodeling a kitchen does not guarantee an additional $60,000 in property value.
Buyers generally compare houses with similar nearby properties.
Expensive upgrades may contribute relatively little when surrounding homes sell at substantially lower prices.
Before undertaking major renovations, homeowners should examine recent comparable sales and determine which improvements local buyers actually value.
Appreciation Doesn’t Equal Financial Profit
A common mistake involves treating every dollar of appreciation as a dollar of profit.
Consider the same $300,000 property after five years.
| Item | Amount |
| Original purchase price | $300,000 |
| Estimated selling price | $360,000 |
| Gross appreciation | $60,000 |
| Selling expenses (6%) | -$21,600 |
| Maintenance and repairs | -$15,000 |
| Gain after these costs | $23,400 |
Although the property appreciated $60,000, selling expenses and maintenance substantially reduce the financial benefit.
Even the remaining $23,400 does not represent a complete profit calculation.
Mortgage interest, insurance, property taxes, purchase closing costs, inflation, and potential capital gains taxes can further affect the outcome.
Mortgage principal repayments also matter when calculating equity and cash proceeds.
Consequently, average home appreciation per year measures property value growth, not the homeowner’s actual investment return.
The Average Is Useful, but Your Local Market Matters More
Historically, the average home appreciation per year has been approximately 3% to 5%, while the latest available FHFA figures show a 2.4% national increase over the 12 months ending August 2026.
Neither figure determines what an individual property will be worth next year.
Housing prices fluctuate according to borrowing costs, local employment, inventory, property condition, and buyer demand.
For homeowners and prospective buyers, evaluating recent local sales and realistic ownership expenses provides more useful information than relying on historical averages alone.
After all, property values tend to make more sense when measured across years rather than judged by a single monthly headline.

Home Stats Report
Home Stats Report takes a practical, numbers-first look at the American housing market, drawing on decades of real estate experience, historical trends, and the everyday realities of buying and selling homes. Housing has never been as simple as a headline suggests. Home prices rise, mortgage rates change, inventory tightens, and buyers adjust their expectations. Home Stats Report provides market commentary, analysis, and general information for educational purposes only. We do not offer financial, investment, mortgage, or real estate advice.
All reports by Home Stats Report