Electricity rarely gets top billing when people talk about housing costs. Mortgage payments, property taxes, insurance, and repair bills usually get there first.
Yet every refrigerator, air conditioner, water heater, television, and light switch adds another small entry to the monthly cost of living in a house.
U.S. residential electricity averaged 18.31 cents per kilowatt-hour in July 2026.
Compared with July 2025, when the average was 17.45 cents, that represents a 4.9% increase.
Numbers like that deserve some context. A 4.9% annual increase matters, especially for households using a lot of electricity, but it does not mean electricity prices climbed steadily every month in 2026.
Electricity prices are no exception.
Electricity Prices Are Higher Than a Year Ago
User “Behind the Price” perfectly explains in this video the reasons behind rising electricity prices in the U.S. The video will make you understand a cost that affects nearly every household.
July’s residential average of 18.31 cents per kWh was 0.86 cents higher than the 17.45-cent average recorded one year earlier.
Residential electricity sales also increased 1.0% compared with July 2025. Price growth, at 4.9%, was considerably greater than the increase in electricity sold.
For another useful comparison, 2025 as a whole averaged 17.30 cents per kWh for residential customers. July 2026 therefore sat about 5.8% above that annual figure.
One distinction matters here. July’s 18.31 cents is a monthly average, not a full-year 2026 average, and 2026 figures are still preliminary.
Mortgage payments tend to dominate conversations about housing affordability, which makes sense. Still, homeowners have never paid for a house with one bill.
Prices Have Not Risen in a Straight Line
Monthly figures show a much less dramatic pattern than a simple upward line:
April produced the highest average during the first seven months of 2026 at 18.83 cents per kWh. Compared with January, that was an increase of about 7.9%.
May then slipped to 18.44 cents. June fell again to 18.34 cents, followed by another small decline to 18.31 cents in July.
Three consecutive monthly declines do not erase the year-over-year increase. They do show why monthly comparisons need some care.
“One month does not make a trend, and April was already more expensive than July.”
Comparing July 2026 with July 2025 gives a cleaner annual comparison than putting January beside July and declaring that electricity climbed by a certain amount during the year.
Housing statistics have taught me much the same lesson. Pick two convenient months and almost any market can be made to look unusually exciting. Longer comparisons tend to be less cooperative.
What 18.31 Cents Means for a Household
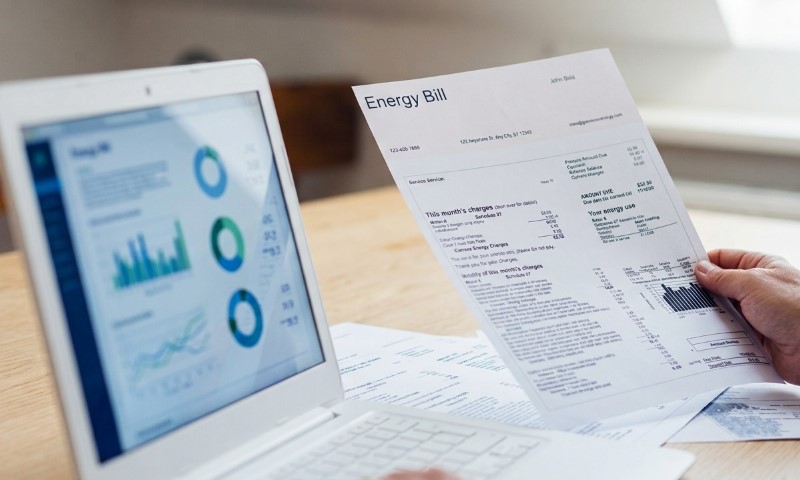
A price expressed in cents per kilowatt-hour can feel abstract until it reaches a monthly bill.
At 18.31 cents per kWh, 300 kWh of electricity costs about $54.93 in variable electricity charges. Usage of 1,000 kWh comes to about $183.10.
At July 2025’s average price of 17.45 cents, the same 1,000 kWh would have cost roughly $174.50. That puts the difference at about $8.60 for 1,000 kWh.
Annualized, a household consistently using that amount each month would spend about $103 more at the July 2026 rate, assuming every other part of the bill stayed unchanged.
Real bills are rarely that tidy.
An advertised or reported electricity rate does not always equal the effective price a household pays after every charge is counted. One billing example shows $187 in total charges for 850 kWh of electricity. Divide the full bill by consumption, and the effective cost is 22 cents per kWh.
Fixed monthly fees can push that figure higher. Delivery charges, taxes, credits, and time-of-use rates can change it again.
Anybody who has reviewed closing documents knows how quickly a simple number can acquire company. Electricity bills have developed much the same habit.
The National Average Hides Huge Differences
Nobody receives a bill calculated at some imaginary national utility office.
Actual residential electricity prices vary enormously across states:
A household paying Louisiana’s average rate was looking at electricity priced at little more than one-quarter of Hawaii’s average.
California’s 33.61 cents was about 84% higher than the national figure. Hawaii’s 48 cents was roughly 162% higher.
Direction also varies by state.
Washington recorded a 9.4% year-over-year increase among the states examined, while Florida recorded a 0.5% decline. One national percentage cannot capture those two experiences very well.
Even statewide figures need caution. Utility territory, local rate schedules, household usage, and billing structure can produce noticeably different costs for customers living in the same state.
“National averages are useful, but nobody pays the national-average electric bill.”
Real estate works the same way. National home prices can tell us something about broad conditions, but buyers still purchase a particular house on a particular street. Utility costs become just as local once somebody starts paying them.
Why Electricity Prices Differ
No single explanation accounts for every electricity price change.
Fuel and power-generation expenses play a role. Transmission and distribution costs matter too. Weather can raise demand sharply, especially during periods of heavy air-conditioning or electric heating use.
State regulation also affects pricing. Retail electricity rates in much of the country are shaped through state regulatory systems, while some states allow customers to choose competitive electricity suppliers offering market-based prices.
Utility structure and the customer’s specific rate plan can add another layer.
All of that matters when a bill suddenly looks expensive. Higher consumption may be responsible. A higher rate may be responsible. Fixed charges may have changed.
Several things can happen at once.
We saw a similar mistake plenty of times in housing. Buyers would notice one expense going up and immediately assume they had found the cause of their budget problem. Usually, checking the entire stack of bills produced a less convenient answer.
Why It Matters for Homeowners and Buyers
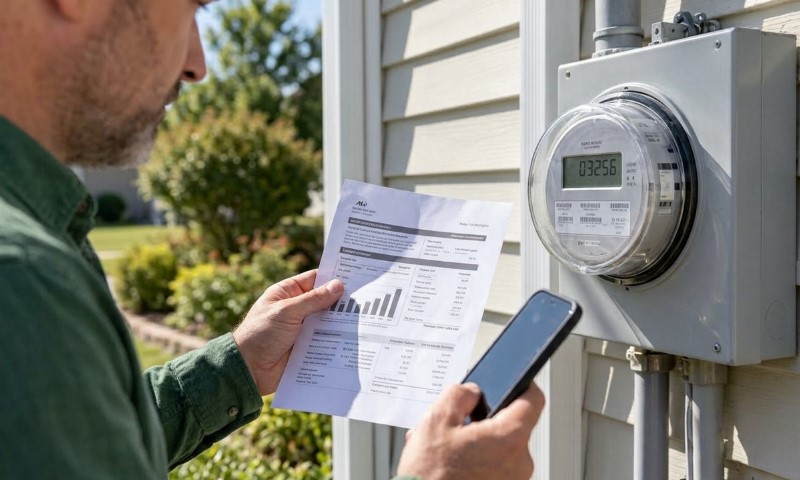
Electricity costs do not affect every house equally.
Home size matters. Climate matters. Insulation quality, HVAC efficiency, appliance efficiency, and household habits all influence consumption.
Heating offers a useful example.
Using a seasonal coefficient of performance of 2.2 for a heat pump, delivered heat would have cost about $23.27 per million Btu at January’s electricity price. At July’s price, the figure would have been about $24.41 per million Btu.
That works out to an increase of roughly 4.9%, closely matching the change in the electricity rate used for the calculation.
Actual household results can differ considerably. Better insulation may reduce the amount of heating required. An older HVAC system may use more electricity. Regional weather can make one winter fairly inexpensive and the next one much harder on the monthly budget.
Homebuyers should pay particular attention here.
Asking for actual utility history can reveal more than applying the national 18.31-cent figure to a house and hoping for a useful estimate.
Past bills show how that property behaves under real occupancy, though differences in family size and thermostat habits still need to be considered.
During my real estate years, two similar houses could produce surprisingly different monthly expenses. One might have newer windows, decent insulation, and a recently installed HVAC system. Another might have an attic that treated conditioned air as a temporary visitor.
“Two houses with the same mortgage payment can still have very different monthly carrying costs.”
That distinction matters even more when buyers are already stretching to cover principal, interest, taxes, insurance, maintenance, and everyday household expenses.
Electricity Is Becoming a Bigger Part of the Housing Conversation
July 2026’s residential electricity average reached 18.31 cents per kWh, 4.9% higher than the 17.45-cent average recorded in July 2025.
April actually posted a higher 2026 figure at 18.83 cents, followed by three months of modest declines. So far, 2026 has not been a simple story of electricity becoming more expensive every single month.
July averages ranged between 12.72 cents in Louisiana and 48 cents in Hawaii, with Texas at 15.88 cents, New York at 29.90 cents, and California at 33.61 cents.
For homeowners, broad averages help show where electricity prices are moving.
Actual bills tell a more practical story about what a particular house costs to operate.
After decades around homebuyers, that distinction feels familiar. Asking what a house costs has never been answered completely by looking at the purchase price alone.

Home Stats Report
Home Stats Report takes a practical, numbers-first look at the American housing market, drawing on decades of real estate experience, historical trends, and the everyday realities of buying and selling homes. Housing has never been as simple as a headline suggests. Home prices rise, mortgage rates change, inventory tightens, and buyers adjust their expectations. Home Stats Report provides market commentary, analysis, and general information for educational purposes only. We do not offer financial, investment, mortgage, or real estate advice.
All reports by Home Stats Report