

Americans paid an average of $2,044 per month on existing mortgages in Q2 2026, according to Federal Housing Finance Agency (FHFA) data.
Actual payments vary considerably. Hawaii homeowners averaged $2,764 monthly, compared with just $1,189 in West Virginia.
I’ve spent enough years discussing home purchases to know that national averages rarely tell buyers what they’ll actually pay.
Property prices, mortgage rates, and purchase dates can make two similar houses considerably different financial commitments.
What Is the Average Monthly Mortgage Payment in the US?

According to the FHFA, the average monthly mortgage payment reached $2,044 in Q2 2026.
Meanwhile, the Federal Reserve’s 2025 household survey reported a median payment of $1,600 among existing mortgage holders.
An average accounts for every payment, including particularly expensive mortgages that push the figure higher. A median identifies the midpoint, with half of borrowers paying more and half paying less.
Another important distinction involves payment calculations.
Some figures include property taxes and homeowners insurance, while others measure only principal and interest.
Consequently, comparisons require consistent definitions and reporting periods.
Average Monthly Mortgage Payment by State
State-level mortgage payments vary significantly, largely because of differences in property values, loan balances, and borrowing costs.
The following figures cover outstanding residential mortgages in Q2 2026, including loans obtained when interest rates were considerably lower.
| State | Average Monthly Mortgage Payment |
| Alabama | $1,502 |
| Alaska | $2,057 |
| Arizona | $1,855 |
| Arkansas | $1,450 |
| California | $2,701 |
| Colorado | $2,413 |
| Connecticut | $2,401 |
| Delaware | $1,799 |
| Florida | $2,146 |
| Georgia | $1,917 |
| Hawaii | $2,764 |
| Idaho | $1,827 |
| Illinois | $1,891 |
| Indiana | $1,427 |
| Iowa | $1,499 |
| Kansas | $1,693 |
| Kentucky | $1,420 |
| Louisiana | $1,592 |
| Maine | $1,671 |
| Maryland | $2,286 |
| Massachusetts | $2,633 |
| Michigan | $1,502 |
| Minnesota | $1,918 |
| Mississippi | $1,442 |
| Missouri | $1,586 |
| Montana | $1,911 |
| Nebraska | $1,736 |
| Nevada | $1,981 |
| New Hampshire | $2,204 |
| New Jersey | $2,744 |
| New Mexico | $1,557 |
| New York | $2,562 |
| North Carolina | $1,779 |
| North Dakota | $1,638 |
| Ohio | $1,502 |
| Oklahoma | $1,567 |
| Oregon | $2,111 |
| Pennsylvania | $1,704 |
| Rhode Island | $2,171 |
| South Carolina | $1,666 |
| South Dakota | $1,743 |
| Tennessee | $1,735 |
| Texas | $2,067 |
| Utah | $2,135 |
| Vermont | $1,717 |
| Virginia | $2,168 |
| Washington | $2,559 |
| West Virginia | $1,189 |
| Wisconsin | $1,558 |
| Wyoming | $1,728 |
| National Average | $2,044 |
States With the Highest Average Mortgage Payments
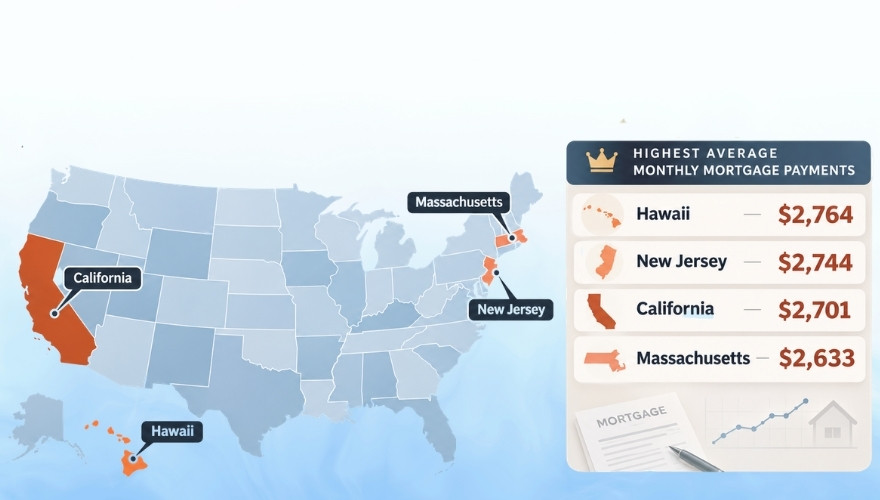
| State | Average Monthly Payment |
| Hawaii | $2,764 |
| New Jersey | $2,744 |
| California | $2,701 |
| Massachusetts | $2,633 |
High property values, limited housing supply, and strong demand contribute to larger mortgage balances in these states.
However, higher mortgage payments don’t automatically indicate worse affordability. Local household incomes also matter.
Existing homeowners with older, lower-rate loans may also pay considerably less than recent buyers purchasing comparable properties.
States With the Lowest Average Mortgage Payments
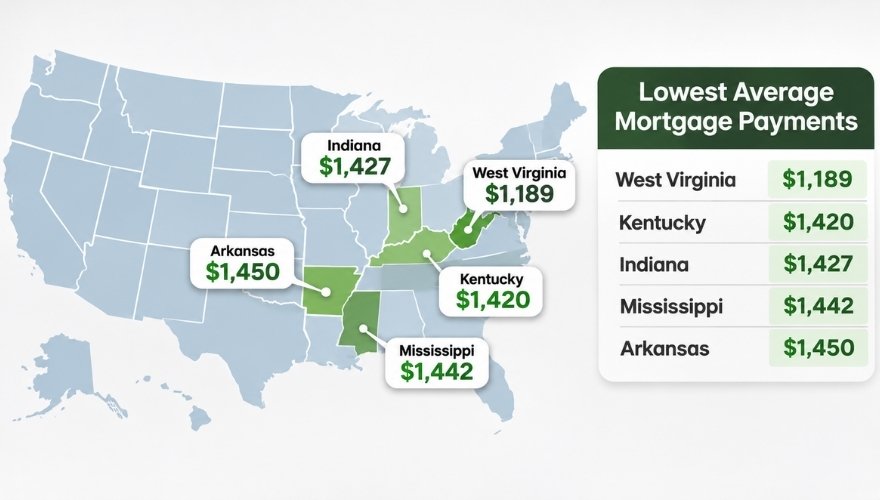
| State | Average Monthly Payment |
| West Virginia | $1,189 |
| Kentucky | $1,420 |
| Indiana | $1,427 |
| Mississippi | $1,442 |
| Arkansas | $1,450 |
Lower property values help explain smaller mortgage payments across these states.
Hawaii’s average payment exceeds West Virginia’s by $1,575 monthly, or $18,900 annually. That’s approximately 2.3 times as much.
Still, lower mortgage payments don’t guarantee better affordability. Lower local wages can offset part of the savings.
Why Mortgage Payments Vary So Much Between States
Three factors account for much of the difference.
Home Prices
Higher purchase prices generally require larger mortgages.
The size of a property also influences its price, and understanding the average square footage of a house in the US can help put housing costs into perspective.
Consider two properties purchased with 20% down:
- A $250,000 home requires a $200,000 mortgage.
- A $500,000 home requires a $400,000 mortgage.
Assuming identical interest rates and repayment terms, the second property produces twice the monthly principal-and-interest payment.
Mortgage Rates and Purchase Timing

Existing homeowners may have significantly lower payments because they secured their mortgages during periods of lower interest rates.
Federal Reserve data indicates that homeowners who moved into their properties during 2024 or 2025 reported a median mortgage payment of $2,300, compared with $1,600 among all existing mortgage holders.
For a $300,000 mortgage with a 30-year repayment period, monthly principal-and-interest payments would look like this:
| Fixed Interest Rate | Monthly Payment |
| 3% | $1,265 |
| 5% | $1,610 |
| 7% | $1,996 |
Illustrative calculation excluding property taxes and insurance.
Moving between 3% and 7% increases the monthly payment by approximately $731, even though the original loan amount stays identical.
Down Payments and Additional Costs
Larger down payments reduce mortgage balances and monthly borrowing costs.
A California mortgage calculation based on January 2024 assumptions produced the following results:
| Down Payment | Monthly Principal and Interest |
| 10% | $4,580 |
| 20% | $4,071 |
| Monthly savings | $509 |
Increasing the down payment produced $6,108 in annual payment savings under those assumptions.
However, committing additional cash upfront reduces available savings. Conventional loans with down payments below 20% also generally require private mortgage insurance.
Property taxes, homeowners insurance, maintenance, and association fees can further increase ownership expenses.
Does a Lower Mortgage Payment Mean a State Is More Affordable?

Not necessarily. Housing costs need to be measured against local earnings and other living expenses.
Cost-of-living research published in 2024 reported the following figures:
| State | Annual Essential Expenses |
| Mississippi | $32,336 |
| Hawaii | $55,491 |
Mississippi’s average annual salary was approximately $47,569, while Massachusetts averaged $80,329.
Mississippi residents had an estimated $15,233 in disposable income after the essential expenses included in that research.
Lower expenses frequently accompany lower salaries, making mortgage payments alone an incomplete affordability measure.
Consider two households earning $6,000 monthly before taxes:
- Household A pays $1,500 toward its mortgage, equivalent to 25% of gross income.
- Household B pays $2,200, equivalent to approximately 36.7% of gross income.
Household A has a lower mortgage burden, but insurance premiums, property taxes, commuting expenses, and maintenance could change the overall comparison.
A $1,500 mortgage on a house needing a $20,000 roof replacement can quickly lose its financial advantage.
Buyers should calculate total monthly ownership costs and allow room for repairs rather than comparing mortgage payments alone.
The Bottom Line
At $2,044 monthly in Q2 2026, the average American mortgage payment conceals substantial differences between states.
Hawaii homeowners averaged $2,764, while West Virginia homeowners averaged $1,189. Property values, mortgage rates, purchase timing, and local wages help explain the gap.
For buyers, the more useful calculation combines principal, interest, taxes, insurance, maintenance, and household income.
Real estate has always been local. National averages provide context, but personal finances determine what a household can comfortably afford.

Home Stats Report
Home Stats Report takes a practical, numbers-first look at the American housing market, drawing on decades of real estate experience, historical trends, and the everyday realities of buying and selling homes. Housing has never been as simple as a headline suggests. Home prices rise, mortgage rates change, inventory tightens, and buyers adjust their expectations. Home Stats Report provides market commentary, analysis, and general information for educational purposes only. We do not offer financial, investment, mortgage, or real estate advice.
All reports by Home Stats Report