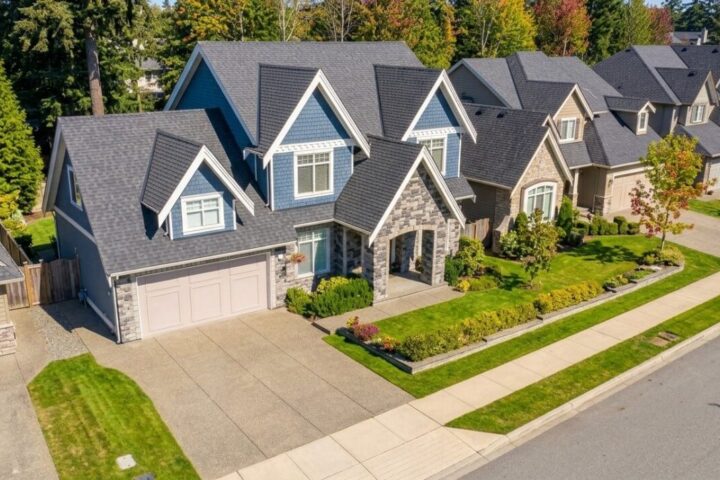

My childhood home was not the sort of place anyone would have described as a trophy property. It was practical, ordinary, and built for a family that needed bedrooms, a kitchen, a yard, and a roof that behaved itself most of the time. Houses like it once sat within reach of families who earned decent but unexceptional incomes.
Nobody thought buying one was effortless. Still, a modest house and an ordinary paycheck often had a recognizable relationship to each other.
A comparable home in many markets now asks far more of a buyer’s income, savings, and monthly budget. Sticker price tells part of the story, but not enough of it.
The latest US home price rise tells that story perfectly.
Buying a Home Was Never Easy
Nostalgia has a habit of sanding off the rough edges. Earlier buyers dealt with recessions, layoffs, weak local economies, difficult closings, repair bills, and mortgage rates that could climb into double digits.
Plenty of people stretched their budgets before anyone could post the experience online. Some bought houses needing serious work because that was what they could afford.
Others simply waited. Memory should not turn all of that into a period when every young couple bought a house after three months of saving. Among adults ages 25 to 34, millennial homeownership stood at 37% in 2015.
That was about 8% below Gen Xers and baby boomers at the same age, equal to roughly 3.4 million fewer homeowners.
Numbers like that deserve more attention than a tidy story about young people preferring flexibility or delaying adulthood. Lifestyle choices matter for some buyers, but so do prices, debt, wages, financing costs, and the amount of cash needed before anyone receives a set of keys.
My years in real estate made me suspicious of any explanation that fits neatly into one sentence. Housing rarely cooperates with neat explanations.
Buying a home was never easy. Financial obstacles today, though, are different in size and composition, and several of them now arrive at the same time.
The Affordability Gap Has Widened
Price growth since 2019 shows how quickly that pressure increased. Between 2019 and 2024, inflation-adjusted median U.S. home value increased 30%, moving up to $350,000 after sitting at $269,600. Income for households headed by someone under 40 increased only 9% during that period, reaching $100,900 after sitting at $92,700.
Those numbers matter more together than apart. According to Pew Research, the price-to-income ratio rose to 3.5 by 2024 after measuring 2.9 in 2019. Before 2000, that ratio generally hovered near 2.5. In plain terms, home prices have been requiring a larger portion of household earning power.
A buyer can hear that a house appreciated by $80,000 and think only about the seller’s gain. Anyone who has owned property knows the arithmetic is messier. Mortgages, taxes, insurance, repairs, roofs, furnaces, and years of maintenance all take their share.
Affordability works the same way in reverse. Asking price may be the number printed on the listing, but household income determines how heavy that number feels.
Still, national figures are useful when they show a broad shift. In this case, they show that younger households gained income, but home values moved much faster.
The Monthly Payment Tells the Real Story
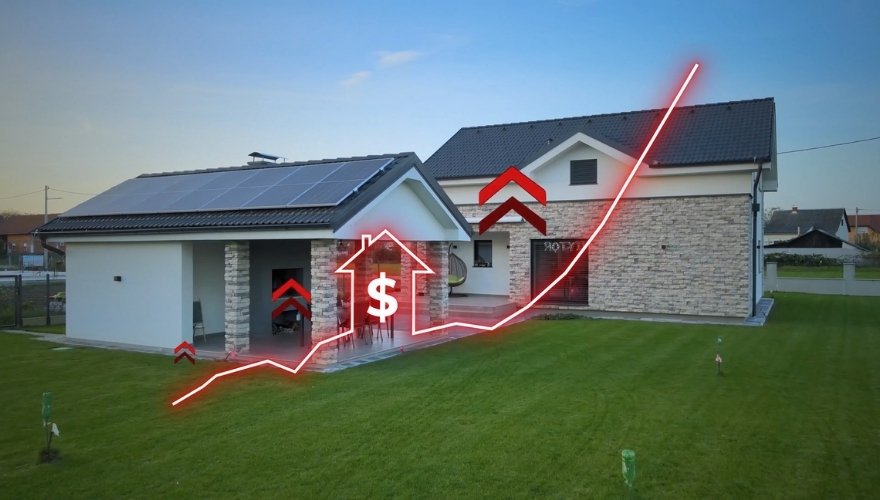
Purchase price gets attention because it is easy to quote. Monthly cost is what buyers live with. The average 30-year mortgage rate was 3.9% in 2019. By 2026, it had risen to 7%.
That change landed on top of higher home prices. Estimated monthly ownership cost for a median-priced home climbed to about $2,776 in 2024 after measuring about $1,689 in 2019.
Among renter households headed by someone under 40, the estimated share able to afford that modeled monthly cost dropped to 37% after sitting at 56% in 2019.
That is a substantial shift over five years. I remember mortgage rates that would make a younger loan officer spill his coffee. Anyone who bought during high-rate years knows 6.7% is not some unprecedented financial monster.
Context matters, though. A painful rate on a modest loan and a moderate rate on a very large loan create two different household budgets:
- Older buyers sometimes faced punishing interest costs on much smaller principal balances.
- Younger buyers can face lower rates than those historical peaks while borrowing far more money.
Buyers do not live inside price-to-income ratios. They live with the payment due every month, plus taxes, insurance, repairs, utilities, and everything else that keeps a house functioning. A listing can look manageable right up until financing turns it into something else.
Getting the Down Payment Is Another Barrier
Monthly affordability matters only after a buyer clears the first hurdle: getting enough cash together to close. A 3.5% down payment plus typical closing costs required roughly $17,500 on a median-priced home in 2019. By 2024, that figure had climbed to about $22,800.
An extra $5,300 may not sound dramatic to someone already sitting on substantial savings. For a renter paying current housing costs while trying to save, it can mean many additional months of work.
Among renters, 49% said inability to afford a down payment was one reason they rented instead of owning. That figure fits what I saw for years. Plenty of would-be buyers could handle a monthly payment on paper yet struggled to assemble the upfront cash.
Closing costs, inspections, moving expenses, immediate repairs, and emergency savings do not disappear just because a lender allows a smaller down payment.
Even a modest percentage down on an ordinary house can become a large cash requirement once the property itself costs several hundred thousand dollars.
Buyers then need enough money left over to deal with the first plumbing leak, broken appliance, or unpleasant surprise behind a wall. No real estate agent enjoys watching a buyer use every available dollar at closing. Houses have terrible timing.
It Is Happening in Most Markets
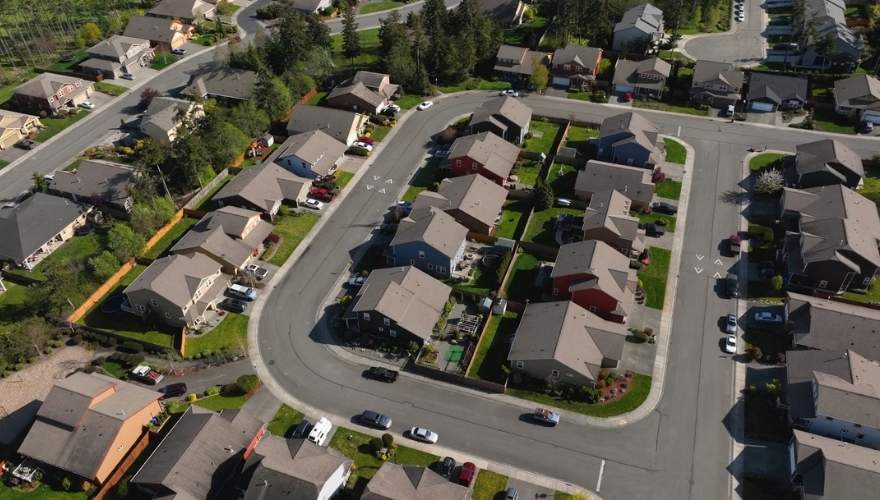
Expensive coastal cities attract attention, partly because their numbers are spectacular enough to make good headlines. Affordability trouble is much broader.
Between 2019 and 2024, home values grew faster than young-adult incomes in 142 of 160 metro areas studied.
The share of metro areas classified as somewhat or very unaffordable rose to 61%, compared with 41% in 2019. That does not mean every market behaves alike. Real estate has always been local. National numbers are useful, but nobody buys the national median home.
Some cities still offer starter homes at prices that would look miraculous in San Francisco or New York. Other places have seen once-modest neighborhoods move sharply upward in price.
Averages should start a conversation, not end one. Still, 142 of 160 metro areas moving in the same general direction is hard to dismiss as a problem limited to a few famous ZIP codes.
For younger buyers, location can change the size of the problem. It does not always erase it.
Why Housing Became Harder to Afford
People like one villain, but I must say housing rarely offers one. Insufficient construction matters in many places. So do land prices, labor costs, material costs, financing conditions, local building rules, infrastructure limits, and strong demand in areas where people want or need to live.
Mortgage rates can cool buying power without causing sellers to cut prices enough to compensate.
Owners who locked in very low rates may also hesitate to sell, which can restrict listings and make already-tight inventory even tighter. New construction helps, but builders face their own costs and constraints.
Comparable twenty-somethings in the 1990s had a 47% ownership rate. Rising house prices relative to income and inadequate construction have played major roles.
Still, one lesson travels well: when household formation and demand keep running into limited housing supply, affordability gets difficult.
After three decades around property transactions, I became wary whenever someone described a housing market with one adjective. Too many moving parts sit behind the result.
Closing Thoughts
Earlier generations did not walk into homeownership without sacrifice. High interest rates, recessions, repair bills, unstable jobs, and bad timing caused plenty of sleepless nights.
Younger buyers are not facing an impossible market either. People still buy homes every day, often by adjusting location, size, timing, or expectations.
Yet pretending nothing substantial has changed would ignore what the numbers show. Public perception has followed those changes. Among Americans under 40, 89% say buying a home is harder for young adults today than it was for their parents’ generation. We can understand why.

Home Stats Report
Home Stats Report takes a practical, numbers-first look at the American housing market, drawing on decades of real estate experience, historical trends, and the everyday realities of buying and selling homes. Housing has never been as simple as a headline suggests. Home prices rise, mortgage rates change, inventory tightens, and buyers adjust their expectations. Home Stats Report provides market commentary, analysis, and general information for educational purposes only. We do not offer financial, investment, mortgage, or real estate advice.
All reports by Home Stats Report